Buttonizer was born to help you to get more interactions and conversion from your website visitors 💟
As you probably know already Buttonizer automatically tracks each click on one of the buttons in your Google Analytics account (https://community.buttonizer.pro/d/17-tracking-conversion-with-google-analytics).
But the next step is to analyse how your Buttonizer buttons are performing. Which buttons lead to the most conversion goals? Which visitor profile uses which button the most? How do the Buttonizer interactions help my conversion rate?
One way to measure the difference between users who interact with Buttonizer and users who don't is to make a custom segment. So here are all the steps you need to take:
- First make sure that you have all your goals (conversions) you want to measure in your google Analytics account
- Second look in your analytics events if Buttonizer gets measured (https://community.buttonizer.pro/d/17-tracking-conversion-with-google-analytics)
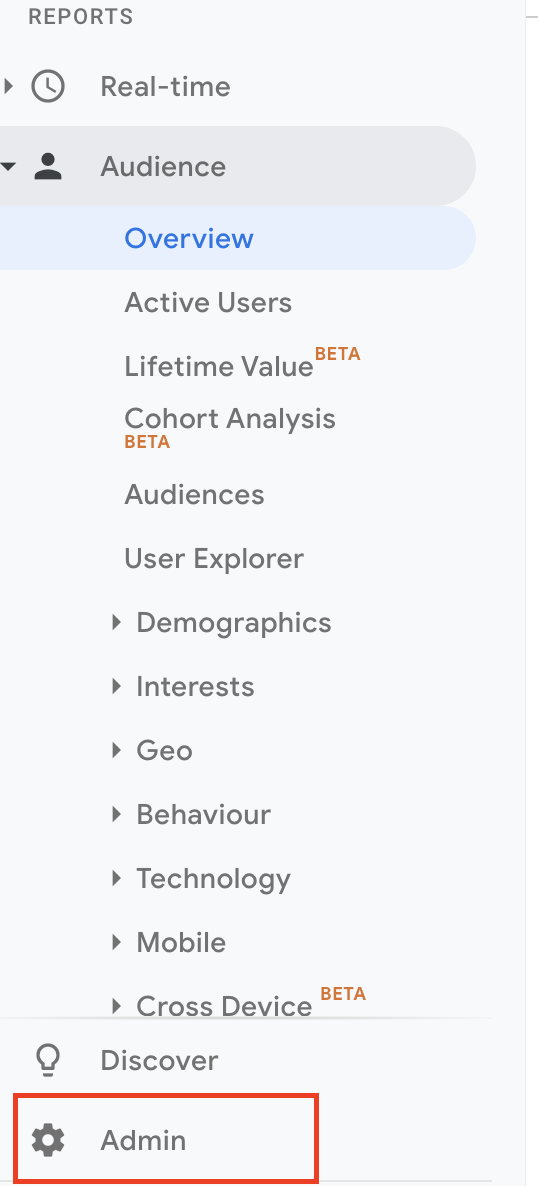
- Go to your Google Analytics account click on settings (left corner) and go to your view settings

- There you can find a setting called 'segments'
![]https://buttonizer.pro/wp-content/uploads/2019/10/Schermafbeelding-2019-10-09-om-20.39.31.png)
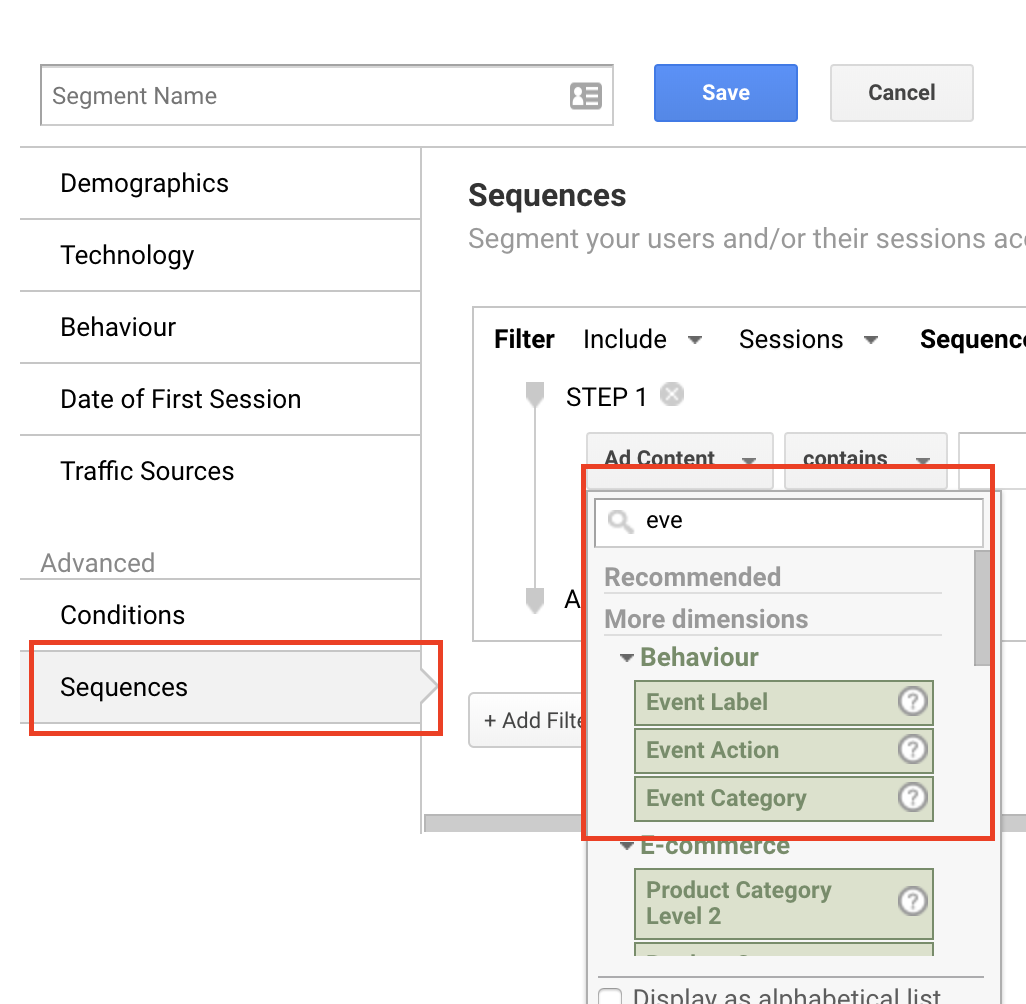
- Click on make new segment
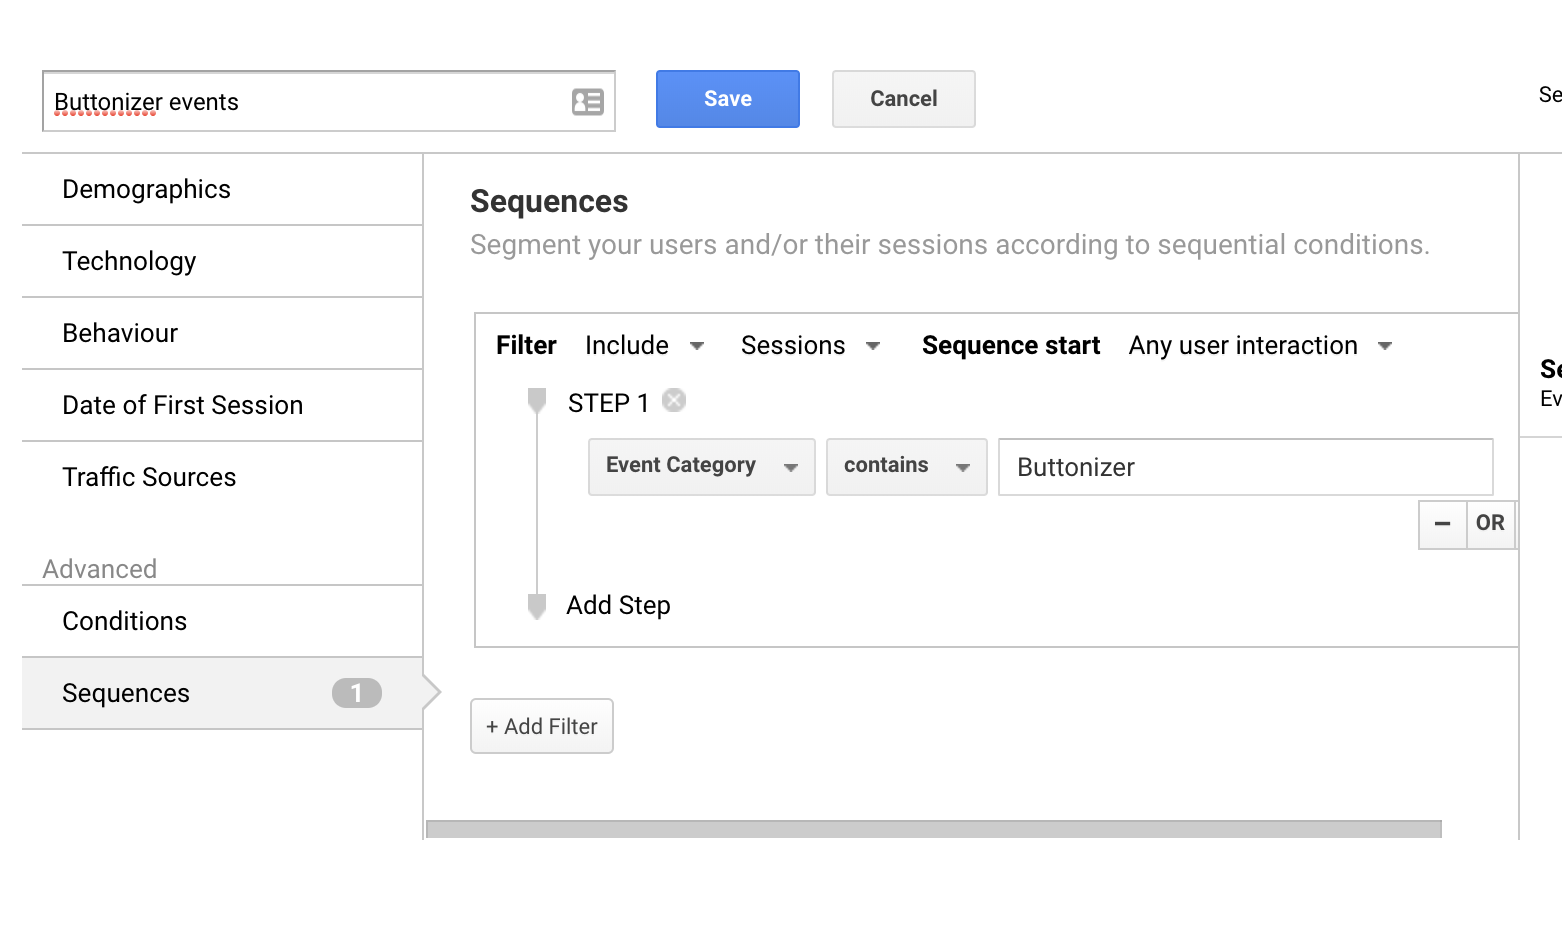
- Click on the last option and select event categories (or event label if you want to track different buttons from Buttonizer). When you have selected event categories you can select 'contains' and then write 'Buttonizer'.


- Go back to your google analytics view and click at the top the + button and add your new saved segment

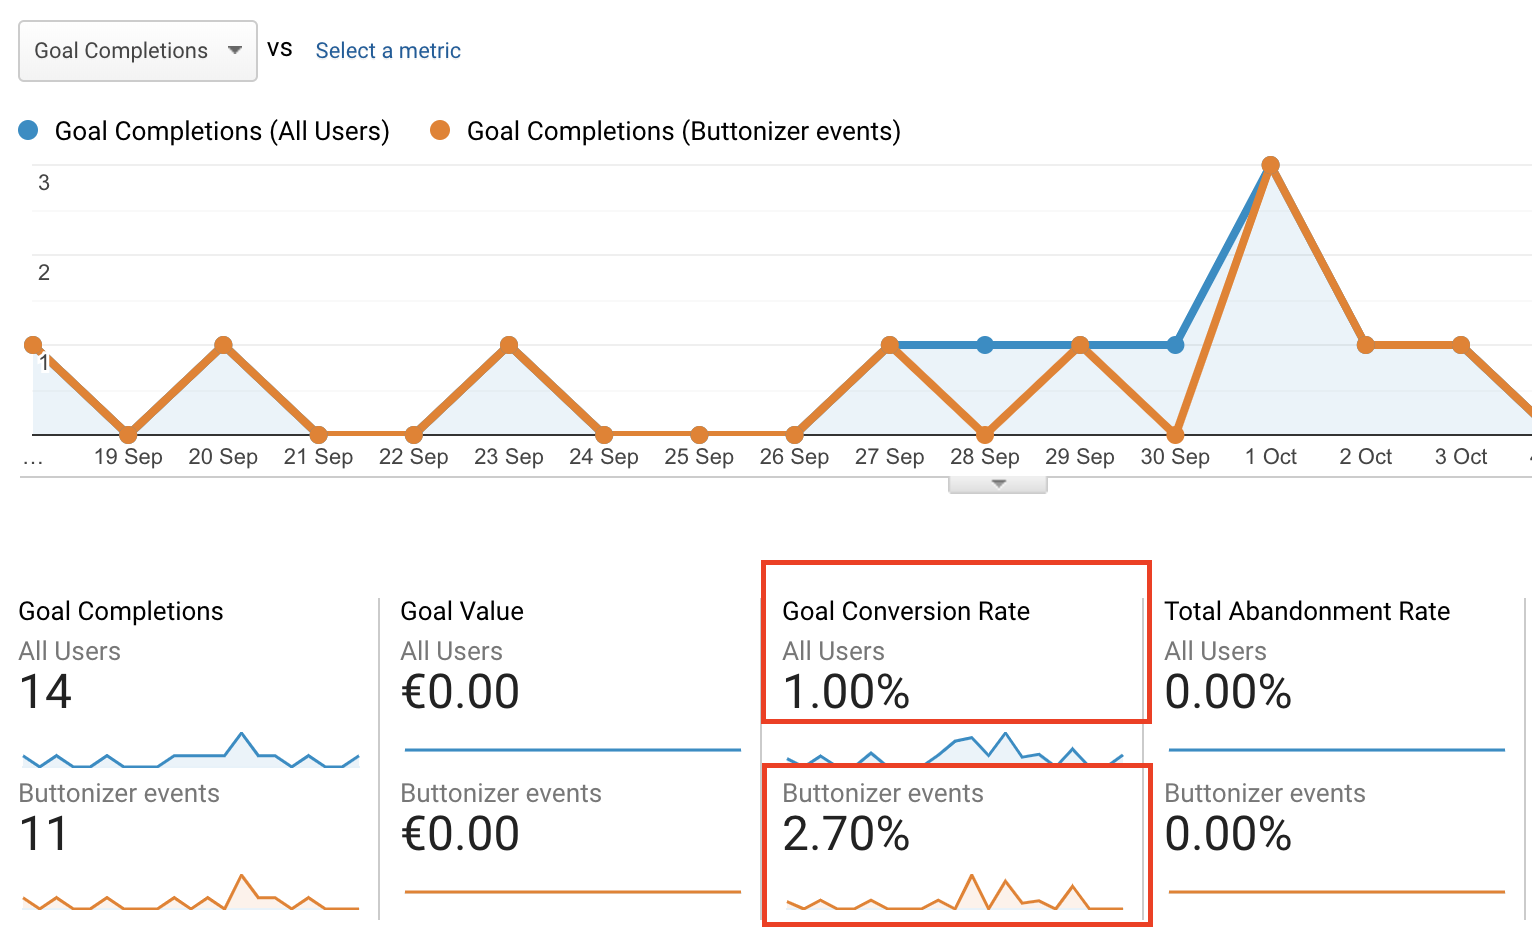
- Then you can see the difference in behaviour between visitors who click on Buttonizer buttons and all other visitors.
- If you go to the acquisition tab in Analytics you will see a conversion rate from the Buttonizer segment and can zoom in on all your different goals
